The new AMC Dashboard
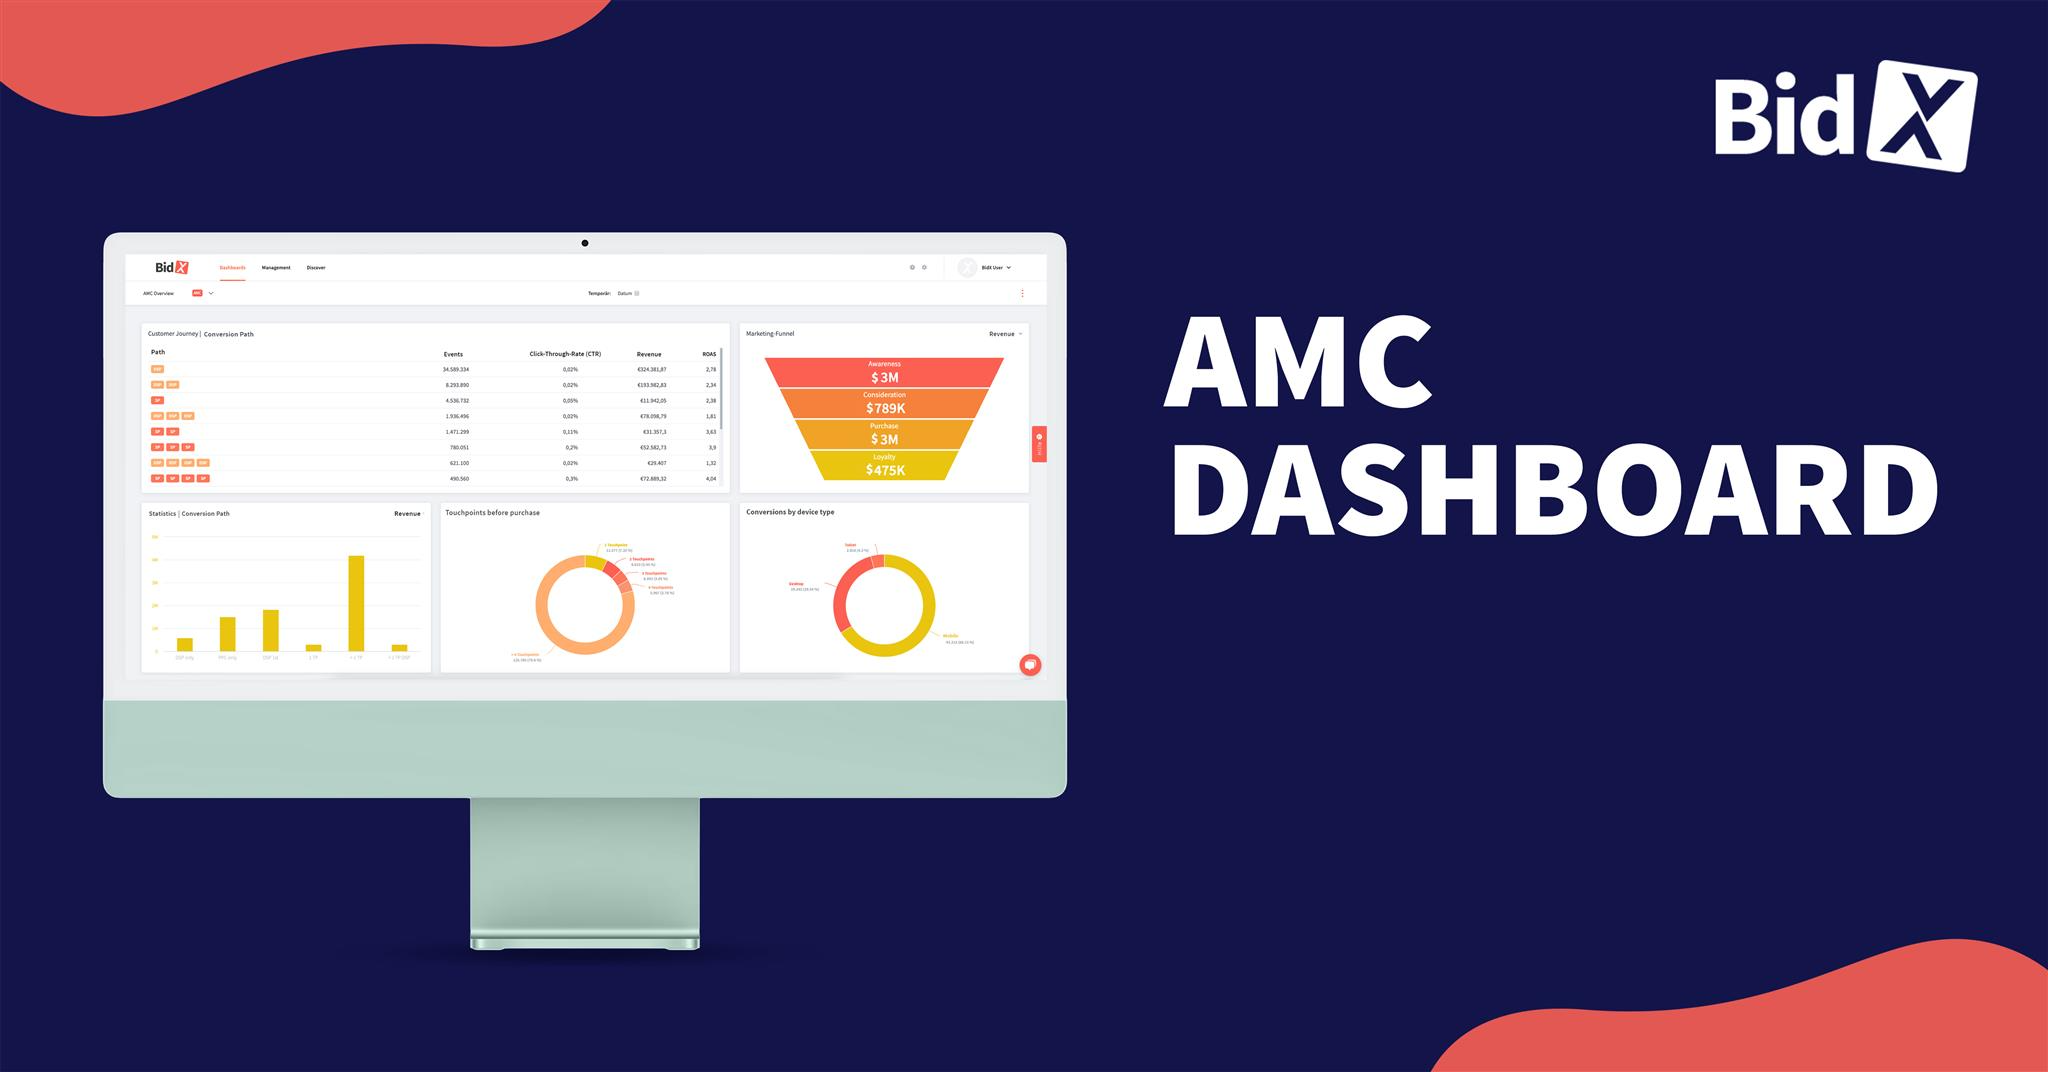
We are continuously working on improving our tool for you and developing new helpful features. For this reason, we are especially excited to announce our newest addition to the BidX tool: The AMC Dashboard. In the following post, we'll explain what the AMC (Amazon Marketing Cloud) is and how it works. Afterward, you'll get a glimpse into our AMC Dashboard and learn what insights you can draw from it and how you can benefit from the data.
What is the Amazon Marketing Cloud?
Amazon Marketing Cloud (AMC) is a cloud that uses anonymized customer data from Amazon to provide information to sellers.
The AMC is a privacy-protected cloud where analytics can be performed on vast amounts of pseudonymized data to provide accurate insights into customer behavior. Amazon Marketing Cloud helps advertisers better understand how their marketing efforts are performing across channels (Search, Ads, Video, Audio).
Amazon Marketing Cloud consists of a web-based user interface that makes it possible to perform immediate information queries. All relevant data sets, such as impressions, clicks and conversions, can be queried from their ongoing campaigns. With the help of this information, advertisers can make informed decisions for their marketing channels. But we at BidX offer an even better solution for this, which is also much more convenient.
How does the Amazon Marketing Cloud work?
Amazon Marketing Cloud works with individual instances. These instances contain data from only one advertiser at a time. There are advertisers with multiple IDs to represent different business units, brands, or subsidiaries. If these IDs are associated with the same company, the data can be placed in the same AMC instance.
On the day an instance is created, it is populated with the past 28 days of advertising data. On the day the instance is created, you can query only those 28 days that are available in the instance. From then on, the advertising data will be stored in your instance for up to 12.5 months. This means that one year after you create your instance, you can always see the latest 12.5 months of data in the instance.
Our new Dashboard
Now on to our newest feature, the AMC Dashboard.
Why is using it so much easier and more convenient than querying the data via Amazon itself?
The answer is simple: If you want to make a query via Amazon, it is mandatory to have good knowledge of SQL programming language. Of course, this is not necessary with us. Likewise, Amazon's results are always in Excel format, while with us, they are always presented in a clear and concise graphical format to save you the tedious process of data analysis and readout. With our dashboard, it's easier than ever to extract information about your customers and have it analyzed automatically - and this with data from both Amazon itself and third-party providers, summarized in a clear presentation. The reports created for you perfectly represent the interaction of SP, SB, SD and DSP Ads. Our display gives you transparency by showing you the exact time to conversion and the amount of interactions a customer had with their ad. With our tool, you are also able to differentiate between new and existing customers, allowing you to study the effectiveness of your advertising campaigns.
At the current time (June 2023), the AMC Dashboard includes eight graphs and is not included in the pricing.
Below, we'll explain what data you'll see in the AMC Dashboard and how you can benefit from it.
Marketing Funnel

In this diagram, you can track the exact revenue you were able to generate in the different marketing funnel stages (from awareness to loyalty). It is also possible to populate the marketing funnel with the values of ROAS and click-through rate.
Customer Journey

Let's turn to one of the most important visualizations available: The conversion path. This shows all the paths that customers take until they convert through your ad. The overview is structured according to the type of campaign, either a DSP campaign or a sponsored campaign. It also shows how often your ad was displayed until conversion and whether DSP and SP were combined. You can also see how many times your ad was converted and how much revenue was generated from that specific path. Additionally, you can even see the click-through rate and ROAS broken down for each individual path.
Path to conversion

This statistic shows in a concise bar chart which advertising path customers most often take to convert. It can be seen as a supplement to the chart above. Amazon only attributes the purchase to the last clicked or last viewed ad. If, for example, DSP was the first contact with the customer and he then buys via PPC, the conversion would be associated with the PPC campaign even though DSP gave the decisive first impulse. In our graph, you can see exactly which ad types led to the conversion.
Touchpoints before purchase

Here, you can see exactly how many touchpoints a customer needs to ultimately buy your product. You can see that most customers need to see your brand several times to develop real interest. Accordingly, it's important to work with retargeting ads and keep drawing potential customers' attention to your products.
Time to conversion

This chart shows how long it takes customers to interact with your advertising. It is broken down by device type. This information is particularly useful for retargeting, as it also shows the time until which you can expect a conversion.
Conversion by device type

With this chart, you can track the end devices that interact with your advertising. This can help you set up the formats of your ads correctly for the end devices and create the ideal ads for your target audience
Geographical distribution

This chart is especially important if you want to use local advertising and plan, for example, local (spoken in dialect) online campaigns. Also, this chart can be very useful if you want to use physical advertising and plan billboard campaigns, for example, because it allows you to identify the best states for your objective.
Customer loyalty

In the currently last available chart, you can see the percentage of new customers in relation to your total customer base, as well as the revenue that new customers bring in compared to existing customers. This is extremely helpful if you are considering planning advertising campaigns specifically targeted at new or existing customers. Also, you are now able to define the importance of different types of customers. Are new customers your main source of income? Do you want to change that with a targeted advertising campaign, etc.?
Conclusion
Amazon Marketing Cloud is a versatile feature. With it, if used correctly, you can gain significant competitive advantages and further increase your competitiveness due to even more targeted advertising campaigns. However, all this requires a lot of effort and mastering a programming language. If you would like to take advantage of AMC without any prior programming knowledge and without the need for analysis and processing, then our AMC Dashboard is exactly what you need. We will be happy to answer all your questions in an expert call!


